Difference between revisions of "Neuroimaging"
From ACL@NCU
| Line 3: | Line 3: | ||
== Statistics == | == Statistics == | ||
#[http://mindhive.mit.edu/node/86 Finite Impulse Response Model] | #[http://mindhive.mit.edu/node/86 Finite Impulse Response Model] | ||
(Excerpt from Mindhive) | |||
The FIR model is a modification of the standard GLM which is designed precisely to deconvolve different conditions' peristimulus timecourses from each other. The main modification from the standard GLM is that instead of having one column for each effect, you have as many columns as you want timepoints in your peristimulus timecourse. If you want a 30-second timecourse and have a 3-second TR, you'd have 10 columns for each condition. Instead of having a single model of activity over time in one column, such as a boxcar convolved with a canonical HRF, or a canonical HRF by itself, each column represents one timepoint in the peristimulus timecourse. So the first column for each condition codes for the onset of each trial; it has a single 1 at each TR that condition has a trial onset, and zeros elsewhere. The second column for each condition codes for the onset + 1 point for each trial; it has a single 1 at each TR that's right after a trial onset, and zeros elsewhere. The third column codes in the same way for the onset + 2 timepoint for each trial; it has a single 1 at each TR that's two after a trial onset, and zeros elsewhere. Each column is filled out appropriately in the same fashion. | "The FIR model is a modification of the standard GLM which is designed precisely to deconvolve different conditions' peristimulus timecourses from each other. The main modification from the standard GLM is that instead of having one column for each effect, you have as many columns as you want timepoints in your peristimulus timecourse. If you want a 30-second timecourse and have a 3-second TR, you'd have 10 columns for each condition. Instead of having a single model of activity over time in one column, such as a boxcar convolved with a canonical HRF, or a canonical HRF by itself, each column represents one timepoint in the peristimulus timecourse. So the first column for each condition codes for the onset of each trial; it has a single 1 at each TR that condition has a trial onset, and zeros elsewhere. The second column for each condition codes for the onset + 1 point for each trial; it has a single 1 at each TR that's right after a trial onset, and zeros elsewhere. The third column codes in the same way for the onset + 2 timepoint for each trial; it has a single 1 at each TR that's two after a trial onset, and zeros elsewhere. Each column is filled out appropriately in the same fashion." | ||
= AFNI know-how = | = AFNI know-how = | ||
Revision as of 11:55, 31 August 2013
Overall Concept
Statistics
(Excerpt from Mindhive) "The FIR model is a modification of the standard GLM which is designed precisely to deconvolve different conditions' peristimulus timecourses from each other. The main modification from the standard GLM is that instead of having one column for each effect, you have as many columns as you want timepoints in your peristimulus timecourse. If you want a 30-second timecourse and have a 3-second TR, you'd have 10 columns for each condition. Instead of having a single model of activity over time in one column, such as a boxcar convolved with a canonical HRF, or a canonical HRF by itself, each column represents one timepoint in the peristimulus timecourse. So the first column for each condition codes for the onset of each trial; it has a single 1 at each TR that condition has a trial onset, and zeros elsewhere. The second column for each condition codes for the onset + 1 point for each trial; it has a single 1 at each TR that's right after a trial onset, and zeros elsewhere. The third column codes in the same way for the onset + 2 timepoint for each trial; it has a single 1 at each TR that's two after a trial onset, and zeros elsewhere. Each column is filled out appropriately in the same fashion."
AFNI know-how
Preprocessing
- Data import
- use to3d or dimon to convert raw images into AFNI BRIK format
- to3d_anat.py, to3d_func.py
- Data file organizations
- creating group list
- getid.py
- looking for the sequential order ID one or more subjects
- lookup_subj.py
- lookup_subj_many.py
- Deoblique
- N.B.: EPI time series data should be time shifted with 3dTshift before rotating the volumes to a cardinal direction
3dWarp -deoblique
Individual level GLM
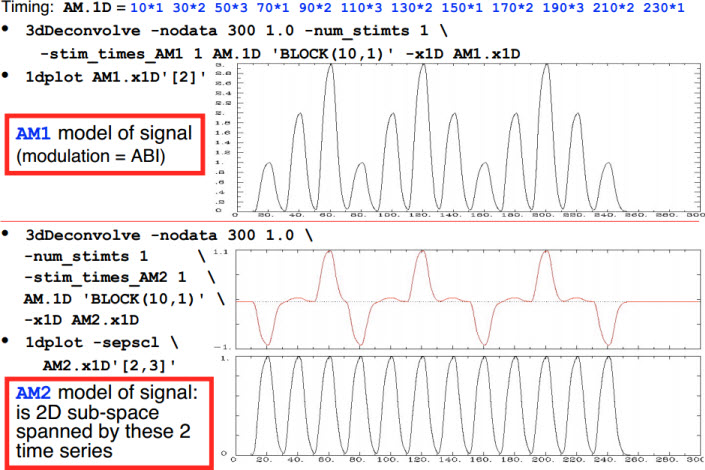
- -stim_times_AM1 and -stim_times_AM2[1]
Group analysis[2]
- Average group T1
Copy 3D+tlrc.BRIK & .HEAD into your "average" directory
3dmerge -doall 3d*+tlrc*
(where "3d*+tlrc* is using enough wild cards to get all the 3D anatomy files you want to average)
The output name is mrg+tlrc.BRIK and mrg+tlrc.HEAD by default, but you can use the -prefix flag to specify an output prefix (other than mrg) that you prefer.
Multiple comparison
- What smoothness parameters should one use for 3dClustSim for results of group analysis?
1. Nick: "You could use a single subject but it's better to take the average across subjects for a more reliable estimate.
That said, in my experience smoothness estimates don't vary that much across subjects if in the same study and everything else is equal (like scanning and preprocessing parameters). "[3]
2. Regarding blur estimates, expect to get estimates per subject and then average those together. You do not want the errts time series averaged down to zero before running 3dFWHMx, as that might play havoc with the estimates (the data might look VERY blurry, I don't know). But I would not expect averaging the errts datasets to increase the reliability of the blur estimation. Averaging over the errts and then over subjects is already (hopefully) generating a very robust estimate. (Rick Reynolds)[4]
Region-of-Interest (ROI)
- Creating a half hemisphere mask
#left hemisphere selected
3dcalc -a mask_group+tlrc. -expr 'step(x-0)' -prefix test

#intersection with brain mask, and save in rh_mask+tlrc
3dcalc -a mask_group+tlrc. -b test+tlrc -expr 'step(a*b)' \
       -prefix rh_mask
- Convert a multi-cluster mask to a union mask (each ROI with the same value)
3dcalc -a Clust_N_Control_p005_mask+tlrc -expr 'notzero(a)' -prefix Clust_N_Control_p005_maskp
Connectivity Analysis
Misc.
- Converting a single t-value to z-value
ccalc -expr 'fitt_t2z(t, n)'
t: tvalue
n: degrees of freedom
- Converting t-value sub-brick to z-value sub-brick
3dcalc -a dset+tlrc[<t-map_id>] \
  -expr 'fitt_t2z(3, 10)' -prefix dset2
- listing all subbriks in a BRIK file and add numerical index
3dinfo -label <BRIK filename> | sed 's/|/\n/g' | nl
- Segmentation (not recommended for quantitative use)
3dSeg 	-anat <anatfile> -mask AUTO \
	-classes 'CSF ; GM ; WM' -bias_classes 'GM ; WM' \
      	-bias_fwhm 25 -mixfrac UNI -main_N 5 \
      	-blur_meth BFT -prefix <output file>
- Extracting grey matter mask from segmented brain
3dcalc -a Classes+tlrc'<GM>' -expr 'step(a)' -prefix TT_icbm452_GMseg
- resample the mask to a coarse resolution
3dresample -dxyz 3 3 3 -rmode 'Cu' -inset TT_icbm452_GMseg+tlrc -prefix TT_icbm_GMseg3mm
- Create partial union mask for a group of anatomical masks
#partial union mask
3dmask_tool -frac 0.3 -input *_GMseg+tlrc.HEAD -prefix punion_0.3.mask
- Look-up dicom raw data header (ID creation time in this case)
dicom_hdr <filename> | grep 'ID Instance Creation Time'
- Use 3dTstat to carry out numerical computations on 1D files[5]
3dTstat -mean -stdev -prefix - fred.1D'[3..8]{5..9}'\' > tjed.1D
1dtranspose fred.1D | 1dplot -stdin
BrainVoyager QX know-how
Preprocessing
Individual level GLM
Group analysis
Multiple comparison
- Cluster threshold estimation (CTE)
- Forming valid mask[8]
- Masking and cluster thresholding[9]
- CTE in BVQX vs. other softwares (AFNI, SPM)[10]
- Solution to "Mask Not Valid!!" problem in CTE
Region-of-Interest (ROI)
FreeSurfurer tutorials
- view data
tkmedit sub001 brain.finalsurfs.mgz -aux T1.mgz -surfs -aseg
- syntax
- sub001: Subject ID
- brain.finalsurfs.mgz: skull-stripped volume primarily used for troubleshooting (found in $SUBJECTS_DIR/good_output/mri).
- aux T1.mgz : pre-skull-stripped volume loaded as 2nd volume (in $SUBJECTS_DIR/good_output/mri)
- surfs : loads all surfaces (orig, white, and pial, for left and right hemispheres)
- aseg : loads automatic volume segmentation called aseg.mgz

